-
Property & Casualty
Property & Casualty Overview

Property & Casualty
We offer a full range of reinsurance products and the expertise of our talented reinsurance team.
Expertise
Publication
Florida Property Tort Reforms – Evolving Conditions
Publication
Is Human Trafficking the Next Big Liability Exposure for Insurers?
Publication
When Likes Turn to Lawsuits – Social Media Addiction and the Insurance Fallout
Publication
Generative Artificial Intelligence and Its Implications for Weather and Climate Risk Management in Insurance
Publication
Engineered Stone – A Real Emergence of Silicosis
Publication
Who’s Really Behind That Lawsuit? – Claims Handling Challenges From Third-Party Litigation Funding -
Life & Health
Life & Health Overview

Life & Health
We offer a full range of reinsurance products and the expertise of our talented reinsurance team.

Publication
Understanding Physician Contracts When Underwriting Disability Insurance
Publication
Voice Analytics – Insurance Industry Applications [Webinar]
Publication
GLP-1 Receptor Agonists – From Evolution to Revolution U.S. Industry Events
Publication
Always On: Understanding New Age Addictions and Their Implications for Disability Insurance
Publication
Dying Gracefully – Legal, Ethical, and Insurance Perspectives on Medical Assistance in Dying -
Knowledge Center
Knowledge Center Overview

Knowledge Center
Our global experts share their insights on insurance industry topics.
Trending Topics -
About Us
About Us OverviewCorporate Information

Meet Gen Re
Gen Re delivers reinsurance solutions to the Life & Health and Property & Casualty insurance industries.
- Careers Careers
The Incredible Shrinking Medicare Supplement Premium Rate

September 08, 2020
Region: North America
English
Remember what the world was like in December of 2015? Barack Obama was President. Star Wars: The Force Awakens was #1 at the box office (remember movie theatres?). Tom Brady only had four Super Bowl rings. And, Medicare Supplement rates in the marketplace were actually higher than they are in 2020.
That’s right. Since 2015, the Med Supp rates available in the marketplace have gotten lower, despite the increasing medical trend over that period which has caused claim costs to rise considerably.
This article studies the industry premium rate trends that have occurred over the last five years and their ensuing impact on industry loss ratios. The analysis below includes the 32 largest states by over age 65 population, with the exception of several nonstandard and/or Medicare Advantage dominated states. (The complete list of included and excluded states is shown in the Appendix at the end of this article.)
In this study, when looking at a carrier’s rates by state, those rates are weighted across the state based on the over 65 census population by zip code and include all available discounts for that carrier (i.e., lowest available rate by zip code).
On that basis, Figure 1 shows what monthly premium rates looked like for plans F and G in December 2015 for the carriers ranked 1st, 3rd, 5th, 10th, 15th, and 20th by competitiveness (i.e., weighted average premium rate) in Ohio at that time. By comparison, rates are also shown for the carriers with those same corresponding competitiveness rankings in March 2020 (different carriers).

Note that for every rank for both Plan F and Plan G rates decreased over the time period. Generally, rates dropped between 5% and 9% on Plan F, and 4% to 16% on Plan G.
For Plan G, the increasing decline in rates by rank shows the significant compression in rates over time. In December 2015, the difference in rate between rank 1 and rank 20 was about 36 dollars. By March 2020, that difference had shrunk to 17 dollars. Plan F was established for many more carriers in 2015, so the compression is not quite as great; even still, the difference in rates between rank 1 and rank 20 reduced from 39 dollars to 32 dollars during that time.
It is also interesting to note that each of the carriers ranked in the top 10 competitively in Ohio as of March 2020 began writing in Ohio in July 2018 or later.
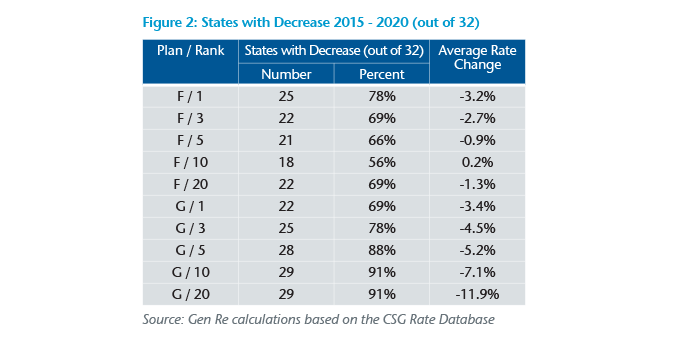
And, while Ohio is a good example, the phenomenon of decreasing rates and plan G compression, led by new carriers entering the market, is very much nationwide. As seen in Figure 2, most states studied had decreasing rates over that period for every rank for both plans F and G. For example, the rates for the carrier ranked 5th for Plan G in March 2020 were lower than the rates for the carrier ranked 5th for Plan G in December 2015 in 28 of the 32 states studied.

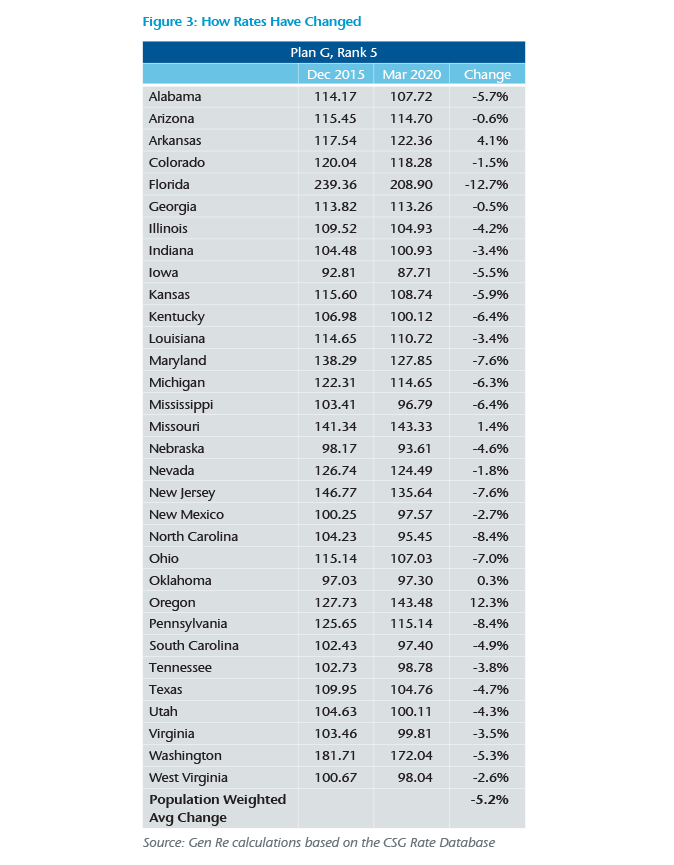
Figure 3 digs deeper into Plan G, Rank 5 to see how rates have changed across each of the 32 states we studied.

On a population-weighted basis, the 32 states saw an average rate decrease of over 5% from December 2015 to March 2020 for Plan G, Rank 5. About 60% of the states (19 of the 32 states), saw rate decreases of somewhere between 3% and 8%.
Across each of these states, rates have slowly and continuously been lowered by new entrants to the market, who steadily push existing carriers out of the top ten in terms of competitive rates. If you entered a state two years ago, even as the carrier with the lowest rates in the state at that time, most likely you are no longer one of the 10 most competitive carriers in that state. On average across the 32 states studied, 4 of the top 5 and 8 of the top 10 most competitive carriers as of March 2020 have entered the market in that state in July 2018 or later.
We could go on and on describing the different ways to view how rates have dropped in the marketplace, but we can summarize the main features of the 2020 market with these three basic observations:
- Overall Med Supp rates are down since 2015 by an average of about 2% on Plan F, and 5% on Plan G, based on the 10 carriers with the lowest rates available in each state then and now.
- The drop is largely driven by the flood of new entrants continuously entering the market near or below the existing lowest rates in the market at that moment.
- Rates are more compressed than ever between the top 20 most competitive carriers in each state, particularly for Plan G — making it is easier for a consumer or agent to find a low rate, and harder than ever for carriers to distinguish themselves in a very crowded marketplace.
Okay then! That’s the first piece of bad news. Now let’s move on to what claim costs have done during this same period.
I discussed the trend in some detail in an article published last year, so let’s cut to the chase with some estimates of claim cost changes. It is safe to say that the annual Medicare Supplement trend has been in the mid to high single-digit range during most or all of this period. So that we don’t have to quibble over details, let us use a couple of different hypothetical average trend numbers to illustrate the increasing gap between premium rates and claim costs in the industry. For our low estimate, let us use a 4% average claim cost trend, and for our high estimate, we’ll use 7% (we believe it was even higher than that in 2018 and 2019).
A 4% annual claim cost trend for the 4½ year study period produces a total increase in average claim costs of 19.3%. A 7% annual trend results in a 35.6% increase during that same period. Let’s split the difference and call it a 27% increase in claim costs over that period, which is about what a 5.5% average claim cost trend produces.
Needless to say, premium rates decreasing by 2% to 5% during a time when claim costs increased by 25% to 30% has not been good for industry loss ratios.
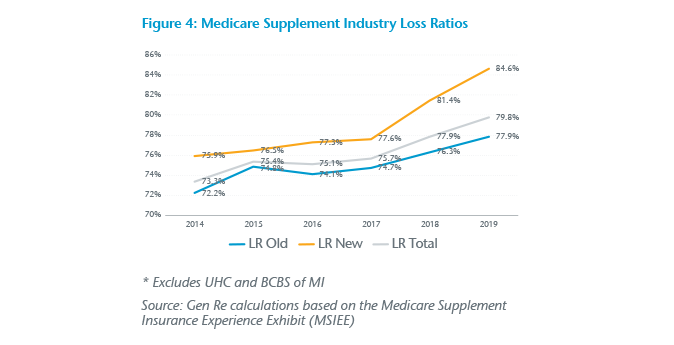
We can look at NAIC experience data for the industry and observe just that. The data is split into policies written in the last 3 years, which we’ll call “New Business”; and older policies, which we’ll call “Old Business.” Figure 4 shows how the loss ratios have changed for the 32 states in our study within those two segments and for the industry in total over the last six years.

Loss ratios on new business had been creeping up slowly over the period 2014 to 2017. But they exploded in 2018 and 2019, increasing by a whopping 7 percentage points in just two years.
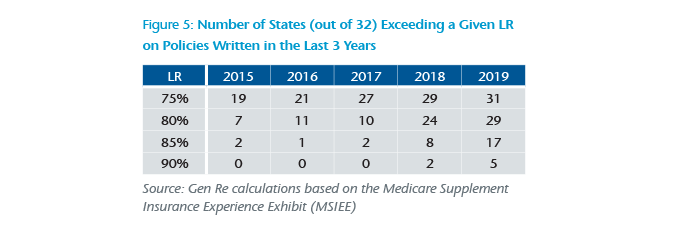
Just as lower rates and higher claim costs are a nationwide phenomenon, so too are increasing loss ratios. Figure 5 looks at how state loss ratios on new business have progressed over the last five years for our 32 states studied.

By 2019, all but one state had a new business loss ratio over 75%. In 2017, only 10 states had new business loss ratios over 80%—just two years later that jumped to 29 out of 32 states. In that same two-year period, the number of states with loss ratios over 85% increased from 2 to 17. Before 2017, no state had a new business loss ratio of over 90%. In 2019, there were five.
When it comes to aging, 50 is the new 40. When it comes to Medicare Supplement loss ratios, 90 is the new 80!
So, there you have it. Lower premium rates plus increasing claim costs equal higher loss ratios. Actuarial science!
Last year I wrote an article about how claim costs were increasing and discussed how premium rates were not keeping up. This article has focused more on premium rates in comparison to those claim costs. I do not want to write another similar article next year, but I fear I may have to. Since we did this analysis on premium rates through March 2020, multiple new carriers have entered the market in ten or more states with very competitive rates (top 10, mostly top 3 to 5).
Launching a Medicare Supplement product with loss ratios in the 80s and 90s in the first three years is an exceedingly difficult way to start a program and produces a long and possibly impossible path back to overall profitability. Unfortunately, I expect that will be the subject of my next article. Stay tuned.


