-
Property & Casualty
Property & Casualty Overview
Property & Casualty
We offer a full range of reinsurance products and the expertise of our talented reinsurance team.
Expertise
Publication
Production of Lithium-Ion Batteries
Publication
Time to Limit the Risk of Cyber War in Property (Re)insurance
Publication
Generative Artificial Intelligence in Insurance – Three Lessons for Transformation from Past Arrivals of General-Purpose Technologies
Publication
Human Activity Generates Carbon and Warms the Atmosphere. Is Human Ingenuity Part of the Solution?
Publication
Inflation – What’s Next for the Insurance Industry and the Policyholders it Serves? -
Life & Health
Life & Health Overview

Life & Health
Gen Re’s valuable insights and risk transfer solutions help clients improve their business results. With tailor-made reinsurance programs, clients can achieve their life & health risk management objectives.
UnderwritingTraining & Education
Publication
The Key Elements of Critical Illness Definitions for Mental Health Disorders
Publication
What Are We to Make of Cannabis Use in The Insured Population? Business School
Publication
Knife or Needle: Will the New Weight Loss Medication Replace Bariatric Surgery?
Publication
Weight Loss Medication of the Future – Will We Soon Live in a Society Without Obesity? Moving The Dial On Mental Health
 -
Knowledge Center
Knowledge Center Overview

Knowledge Center
Our global experts share their insights on insurance industry topics.
Trending Topics -
About Us
About Us OverviewCorporate Information

Meet Gen Re
Gen Re delivers reinsurance solutions to the Life & Health and Property & Casualty insurance industries.
- Careers Careers
When Two Cat Models Diverge and Neither Is Right, What Path Does an Underwriter Take?

June 17, 2019
Andrew Zastrow
Region: North America
English
In our fast-paced, data-driven world, underwriters are increasingly dependent on Cat models to price individual risk locations. But can underwriters price an individual location accurately by using a model? Should they rely on one model, or average the output of multiple models? Is there a “right” answer? What are the implications for the long-term funding of loss costs?
There is a science and art to using Cat models.
Insurers may intuitively know that no model is perfect, but they may not realize by how much. Each model produces a range of estimates for a risk, summarized in a single point estimate. Selecting this point estimate to characterize the risk can provide an artificial level of comfort but doesn’t recognize the underlying volatility of the risk. How can underwriters reduce the margin of error?
For many underwriters, Cat models are used mechanically, as if they can pick the exact dollar amount that should be charged to fund the loss cost of a specific building. But there are flaws in this approach. Even if the construction, occupancy, protections and exposures (COPE) are the same for two risks, there are risk elements that can cause the loss experience to be very different. Complicating an underwriter’s task, the various Cat models can have very different perspectives on the same risk and how individual structures with the same COPE will perform in an event.
Consider identical COPE information for three locations in the eastern U.S. - in North Carolina and Florida - and the results using two models:1
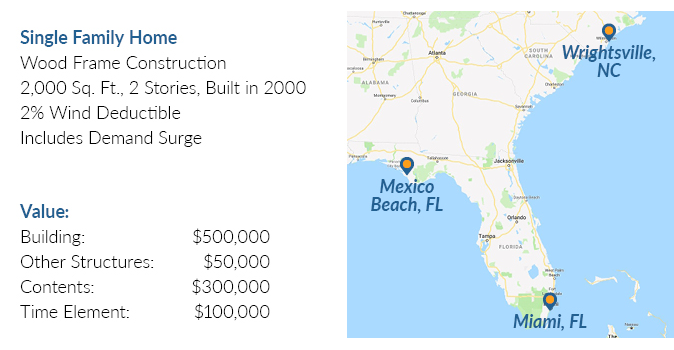
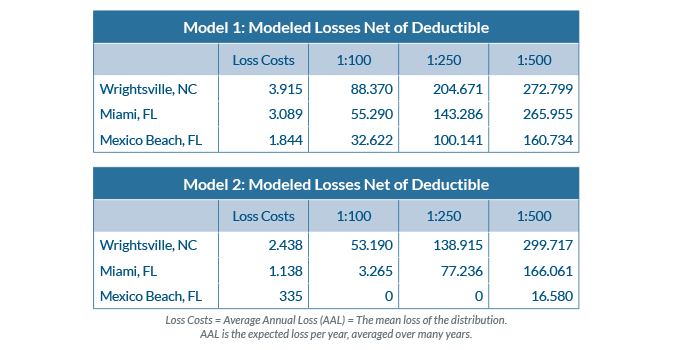
Each model produced dramatically different loss cost output across a range of return periods - in many instances a 50% or higher divergence. If an underwriter only has access to a single model’s output, important elements of the underlying risk may be missed. The higher result may not be the correct answer, but it could be.
Understanding the drivers of the differences is key. One model may better capture the vulnerability of a particular type of construction. The other model might measure the wind speeds at landfall better. One model might measure the impact of deductibles more accurately, while the other might capture the value of contents, additional living expense or business interruption coverage more precisely.
Taking the average of the two models, or mechanically relying on just one model, can lead to underfunding of loss costs over time. Using two models does not necessarily mean a more accurate price but recognizing the strengths and weaknesses of multiple models in the risk evaluation process can lead to a better answer.
If we were to look inside a Cat model, we would find the model outputs a range of estimates across a distribution curve. If an underwriter were able to look at the full range of estimates across both models rather than single point estimates, the spread of the different models would likely be much closer together.
The variance of results across the distribution is what may be most interesting when attempting to set loss costs for a specific location. Fixating on a single, annual loss cost number for a location may be the most practical time-saving approach but may not tell the whole story of a risk. Looking at the full range of results might indicate whether the risk is only vulnerable to a truly intense event or exposed to even minor wind speeds. This type of information would suggest an appropriate insurance structure, and ultimately help the insurer obtain the correct funds for the risk and overall portfolio over time.
The Known Unknowns of Cat Modeling
Models are designed to help the underwriter, yet the modeled result and the actual losses are never identical. When an actual loss happens, it can trigger additional elements of coverage not contemplated in the modeling that increase the size of the loss. At Gen Re, we have paid surprisingly large losses for some of the following reasons:
- If a building is undervalued compared to its replacement cost, the model will not recognize the maximum loss potential. What was expected to be a partial loss ends up being a policy limits loss.
- The restoration period of recovering from an event may be longer than the amount of time the underwriter and the models anticipate, due to factors including claim adjustment complications, limited supplies and contractors, and government evacuations extending interruptions.
- Coverage grants may end up as larger loss dollars than contemplated. Losses incurred under Unlimited Additional Living Expense coverage grants often end up far out of line with modeled predictions.
Science, Art and Underwriting
Every day, underwriters make thousands of decisions that carry an associated financial impact for their company. Company management wants to be able to predict the loss amount should the sum of all these individual decisions be exposed to a single event. The accumulation of these decisions must be supported by the company’s financial surplus and protected by an adequate reinsurance program.
It is not surprising that insurance companies have been turning to probabilistic models of loss to help make underwriting decisions. The models can help guide underwriters, but ultimately underwriters need to make the final decision and use science, as well as art, appropriately. This places added responsibility on a company’s reinsurance structure to ensure they are adequately protected against volatility from large loss events.
Until models evolve, underwriters must understand the assumptions that go into pricing each risk. With that knowledge, insurers can stay on the path to good pricing decisions. Let us know if we can help you evaluate model output and your reinsurance structure before those events hit your book.
Endnote
- All assumptions and output developed by Gen Re, based on widely-used industry Cat models.


