-
Property & Casualty
Property & Casualty Overview

Property & Casualty
We offer a full range of reinsurance products and the expertise of our talented reinsurance team.
Expertise
Publication
Use of Artificial Intelligence in Fire Protection and Property Insurance – Opportunities and Challenges
Publication
Public Administrations’ Liability – Jurisprudential Evolution, Insurance Implications, and a Comparative Analysis Across Countries
Publication
Generative Artificial Intelligence and Its Implications for Weather and Climate Risk Management in Insurance
Publication
Engineered Stone – A Real Emergence of Silicosis
Publication
Risk Management Review 2025 -
Life & Health
Life & Health Overview

Life & Health
Gen Re’s valuable insights and risk transfer solutions help clients improve their business results. With tailor-made reinsurance programs, clients can achieve their life & health risk management objectives.
UnderwritingTraining & Education
Publication
Diabetes and Critical Illness Insurance – Bridging the Protection Gap
Publication
Underwriting the Dead? How Smartphones Will Change Outcomes After Sudden Cardiac Arrest
Publication
Always On: Understanding New Age Addictions and Their Implications for Disability Insurance
Publication
Dying Gracefully – Legal, Ethical, and Insurance Perspectives on Medical Assistance in Dying
Publication
AI Agent Potential – How Orchestration and Contextual Foundations Can Reshape (Re)Insurance Workflows Business School
 -
Knowledge Center
Knowledge Center Overview

Knowledge Center
Our global experts share their insights on insurance industry topics.
Trending Topics -
About Us
About Us OverviewCorporate Information

Meet Gen Re
Gen Re delivers reinsurance solutions to the Life & Health and Property & Casualty insurance industries.
- Careers Careers
Understanding Mortality - Lessons From Older Ages

July 31, 2019
Jean-Marc Fix
English
Mercifully, death happens only once to each of us. Nonetheless as I look at my Facebook feed, I can’t help but notice that death and disease are taking more and more space, surpassing news about weddings and births. You might say aging is an unfortunate, yet inescapable, fact of life. I say it is an opportunity to learn about mortality, past and future.
Mortality Compression and Trends
As mortality rates have decreased at younger ages, a larger proportion of all deaths occurs in a smaller number of advanced years. This increase in concentration of deaths makes for better statistical significance, as more deaths make it easier to get to the true rate of death. For the same reason that it is hard to know if a coin is fair by tossing it only once versus tossing it a million times, with more data you have more information. It also makes it more important to get it right.
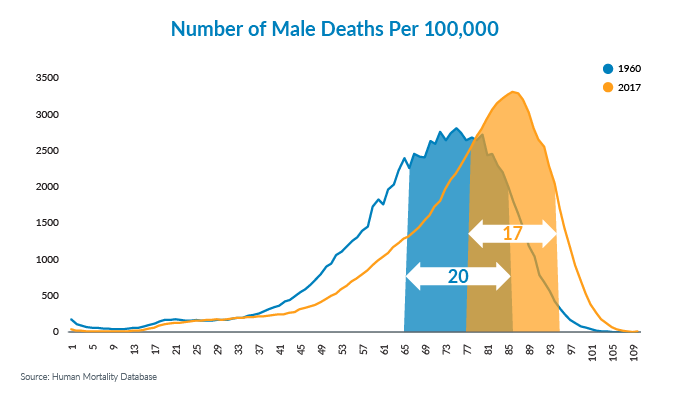
So let’s take a look at the number of male deaths in the U.S. from 1960 compared to 2017.
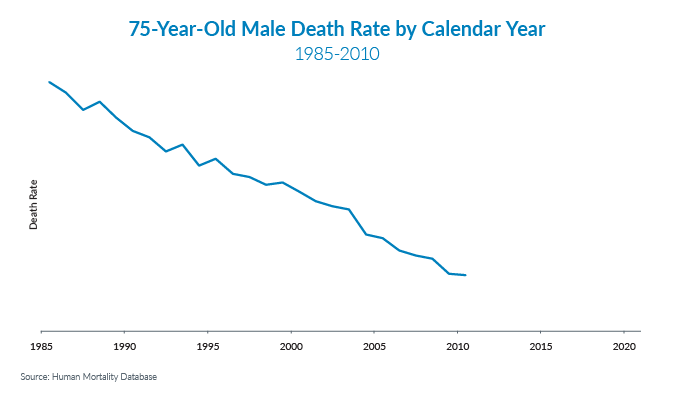
This statistical stability may lure us into a false sense of safety as we try to predict the future. And, what’s happened to the death rate of 75-year-old males before 2010?
What do you think happens if we check the death rate through 2017?
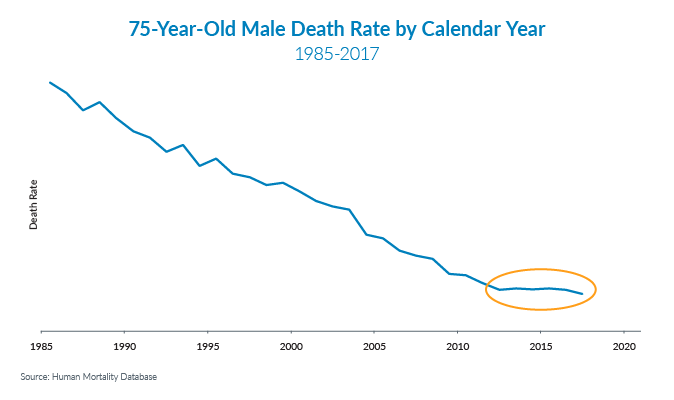
Surprise!
The Issues With Causes of Death
Some, like Jim Vaupel, have posited that life expectancy improves at a very constant rate despite the opinions of experts in the field.1 No rationale is given: It just is, like the Sommerfeld fine structure constant or Moore’s Law. I can’t help but equate it to the uneasy feeling of the person who jumps from the Empire State building and can be heard, as he falls by each floor, saying “…so far, so good…”.
Everyone will die of something. We all, and maybe actuaries and underwriters even more so, like to classify things to help solve problems. We look for insight, trying to understand the cause of death. Of course, understanding the various causes of death can help us predict the future, but this knowledge is of limited long-term value, although causes of death for chronic conditions, especially critical at the older age, have a lot of inertia and do not change quickly, they do change.
Two issues complicate how we can use information about the causes of death. The first is that the recording of the cause of death is fraught with difficulty. When the latest version of the International Classification of Diseases (ICD 10) implemented a different hierarchy of causes, it created a sudden discontinuity in data, requiring macro adjustments in the statistics and artefactual changes in the trends; for instance, the incidence of Alzheimer’s disease.
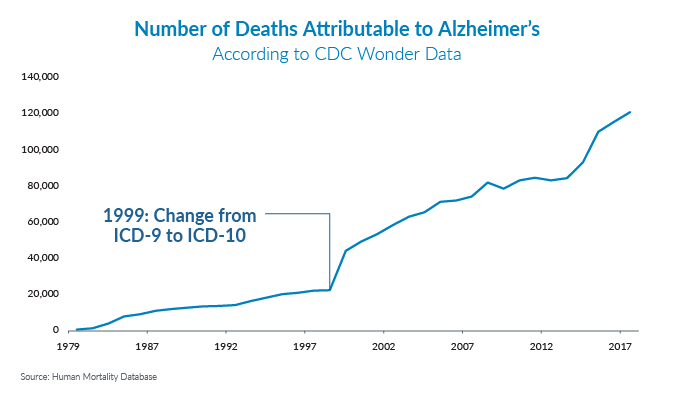
This complicates the accurate and consistent recording of the relevant cause of death.
The second issue is an effect highlighted by the work of John Wilmoth, which modeled causes of death.2 He confirmed, as cited in a soon to be published SOA research report, that the more causes you look at, the more pessimistic your view of future mortality becomes from a mathematical standpoint. The most pessimistic cause with the highest mortality rate tends to dominate your model.
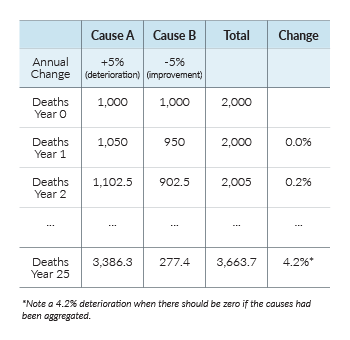
Causes of Death - and Drivers of Mortality
Cause of death doesn’t change by chance. Cause of death is influenced by treatment and medical technology. Today, you don’t necessarily die from a heart attack because we can restore your heart’s function. Yet we know that underlying factors strongly impact causes of death, and they are influenced by demographic and behavioral changes. Most students of mortality will recognize the impact of decreasing smoking prevalence - and increasing prevalence of obesity - in the mortality changes we have seen, although the later has still not had an impact on older ages in a clear way. Very few people have died directly from smoking or from being obese, yet the impact of both is significant and, in my mind, critical to understanding the future of mortality.
Those “causes of causes” are what we call the drivers of mortality. Understanding what they are, their impact, which is changing, and their reach will give us the clues to project mortality in the mid-term. Some we know, such as smoking and obesity. Others we can see coming like the impact of obesity on children or better nutrition and the adoption of a healthy lifestyle around exercise and activity (10,000 steps anyone?). Some are harder to quantify, such as the impact of driverless cars or immunological treatment of cancers such as CAR T-cell immunotherapy.3 Harder to quantify but certainly not safe to ignore.
As for the long term? The distant future is a combination of many factors, both individual and societal. Like in the past, maybe you’ll hear me say as I go by your office window “so far, so good.” Will you think I’m falling, though? Maybe I’m flying…
Endnotes
All mortality charts created via Human Mortality Database (HMD). Life Table for Males and Females 1x1 (Age Interval x Year Interval)
- Vaupel.
- Wilmoth, John R., “Are mortality projections always more pessimistic when disaggregated by cause of death?,” Mathematical Population Studies, An International Journal of Mathematical Demography, Vol. 5, 1995.
- https://www.cancer.gov/about-cancer/treatment/research/car-t-cells.


