-
Property & Casualty
Property & Casualty Overview

Property & Casualty
We offer a full range of reinsurance products and the expertise of our talented reinsurance team.
Expertise
Publication
Use of Artificial Intelligence in Fire Protection and Property Insurance – Opportunities and Challenges
Publication
Public Administrations’ Liability – Jurisprudential Evolution, Insurance Implications, and a Comparative Analysis Across Countries
Publication
Generative Artificial Intelligence and Its Implications for Weather and Climate Risk Management in Insurance
Publication
Engineered Stone – A Real Emergence of Silicosis
Publication
Risk Management Review 2025 -
Life & Health
Life & Health Overview

Life & Health
Gen Re’s valuable insights and risk transfer solutions help clients improve their business results. With tailor-made reinsurance programs, clients can achieve their life & health risk management objectives.
UnderwritingTraining & Education
Publication
Diabetes and Critical Illness Insurance – Bridging the Protection Gap
Publication
Underwriting the Dead? How Smartphones Will Change Outcomes After Sudden Cardiac Arrest
Publication
Always On: Understanding New Age Addictions and Their Implications for Disability Insurance
Publication
Dying Gracefully – Legal, Ethical, and Insurance Perspectives on Medical Assistance in Dying
Publication
AI Agent Potential – How Orchestration and Contextual Foundations Can Reshape (Re)Insurance Workflows Business School
 -
Knowledge Center
Knowledge Center Overview

Knowledge Center
Our global experts share their insights on insurance industry topics.
Trending Topics -
About Us
About Us OverviewCorporate Information

Meet Gen Re
Gen Re delivers reinsurance solutions to the Life & Health and Property & Casualty insurance industries.
- Careers Careers
Medicare Supplement – Results of 2016/2017 U.S. Market Survey

September 07, 2017
Region: North America
English
Gen Re is pleased to present this summary of results for our 2016/2017 U.S. Medicare Supplement Market Survey. The full survey captures Medicare Supplement results and market trends for 2016 by examining sales and in-force numbers, claims trend, underwriting tools and practices, rate increase activity as well as movement across distribution channels. The full report is made available only to participants.
Background
A total of 57 questionnaires were completed for this year’s survey, representing 81 companies with Medicare Supplement (Med Supp) business. Throughout this report, the percentage of companies or number of companies refers to the 57 completed questionnaires. Additionally, depending on the type of question, not all companies were eligible to answer. To aid in your review, the number of responding companies is displayed as R=. Results were excluded from the report if less than four companies provided data.
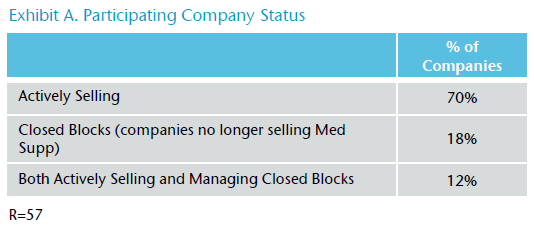
A majority of the participants in this year’s survey are actively selling Med Supp, with seven companies (12%) actively selling and managing closed blocks of business. (Exhibit A)
In-force and sales growth results for the industry and size segments were weighted by company size, which is based on in-force premium. All other results in the study were not weighted by the size of a company’s block of business. Each company has equal weight on the results for the industry and their size segment.
Total Annualized In-force Premium and Lives for 2016
Participating companies in this year’s survey reported a total of $21.7 billion of in-force premium for 2016. This represents a growth of 7.4% over 2015. (Exhibit B) The growth rate increases, however, when focusing only on those companies that were actively selling Medicare Supplement insurance in 2016. The actively selling participants experienced a growth rate of 8.2% in premium and 8.3% in lives.

Total Annualized Sales Premium and Lives for 2016
Total sales premium for actively selling companies totaled approximately $2.4 billion in 2016, an increase of 6.9% from 2015. (Exhibit C) Included in the premium sales growth results is an estimate for one company. The estimated premium figures for 2015 and 2016 were calculated by Gen Re.

While 21 out of 42 companies experienced an increase in sales premium, a few had a disproportionate impact on growth results.
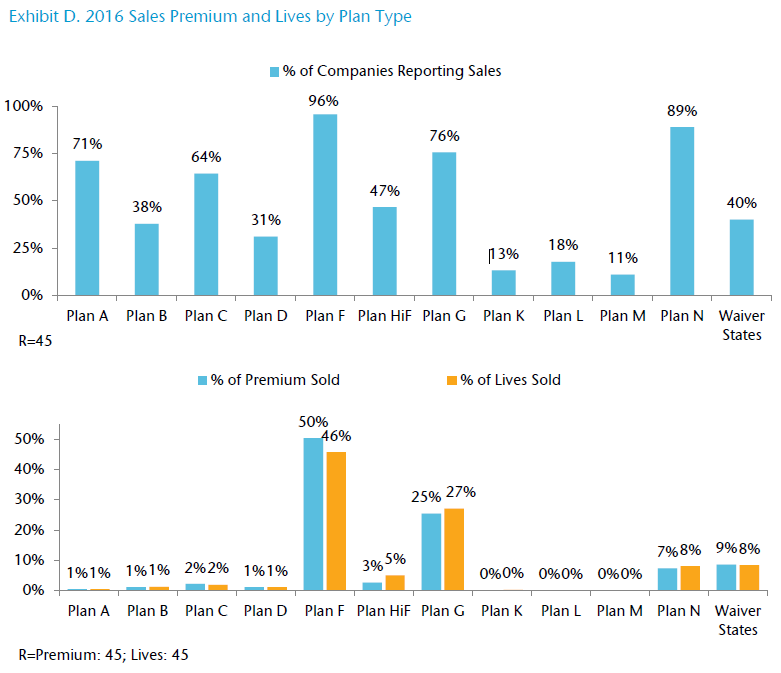
As previously reported, Plan F remains the most sold plan, accounting for 50% of the total premium sold in 2016. (Exhibit D) Additionally, this was the most widely sold plan with 100% of the participating companies selling this plan, excluding the two companies that only sell in waiver states. In comparison, more than 70% of the participating companies reported selling Plans A, G and/or N; however, these three plans only represented 33% of sold premium in 2016.
When reviewing 2016 sales by application type, underwritten applications accounted for more sales premium in 2016 than open enrollment applications. (Exhibit F)

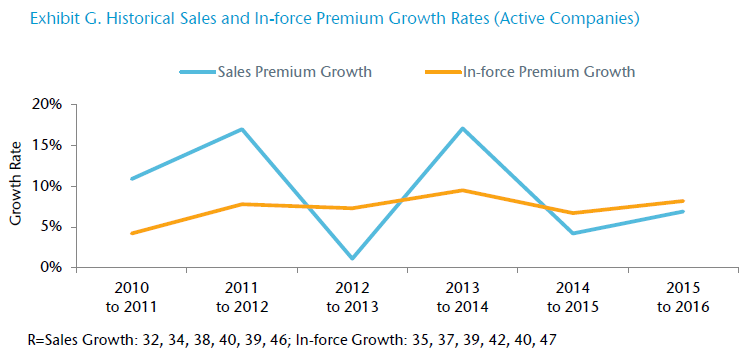
When comparing to historical growth rates, in-force premium has seen more steady growth compared to sales premium, which has been more volatile. (Exhibit G)
2016 Claims Trend
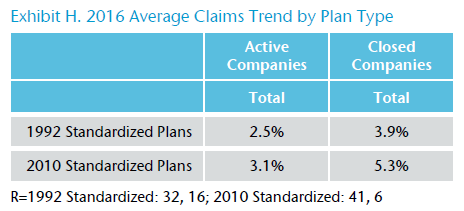
For this year’s survey, some questions were restricted to the most widely held plans (1992 and 2010 Standardized Plans). In comparing these plans for active companies, 2010 Standardized Plans averaged a higher claims trend at 3.1%. (Exhibit H)
Looking to 2017, active companies expect the claims trend to average 4.7% for both 1992 Standardized Plans and 2010 Standardized Plans.
2016 Lapse Rates
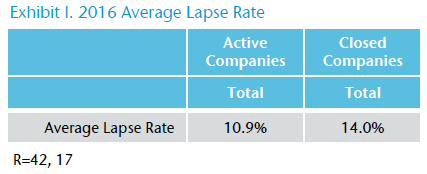
The average 2016 lapse rate was 10.9% for active companies and 14.0% for closed companies. (Exhibit I) Compared to 2015, 48% of the active companies experienced a decrease in their lapse rate while 29% experienced an increase. A majority of the closed companies (53%) also reported a decline in their lapse rate.
2016 Decline and Not Taken Rates (Active Companies Only)
In 2016, on average, 4.2% of open enrollment and guarantee issue applications were not taken. (Exhibit J)
For underwritten applications, on average, 74.8% were approved and placed in 2016, while 16.2% were declined. (Exhibit K) When focusing just on those companies that provided data for 2015 and 2016 (29 companies), the decline rate increased from an average of 15.2% in 2015 to 15.7% in 2016.


Underwriting Resources and Guidelines
The average turnaround time on an underwritten application in 2016 was 5.3 business days. (Exhibit L)
Seven out of 45 companies reported using an automated underwriting system, with four additional companies planning to add this system in the next 24 months. An automated underwriting system was defined in the questionnaire as a system to approve underwritten, web-based applications without human involvement. Of the applications going through this automated underwriting system, on average, 15% were approved.

Distribution (Active Companies)
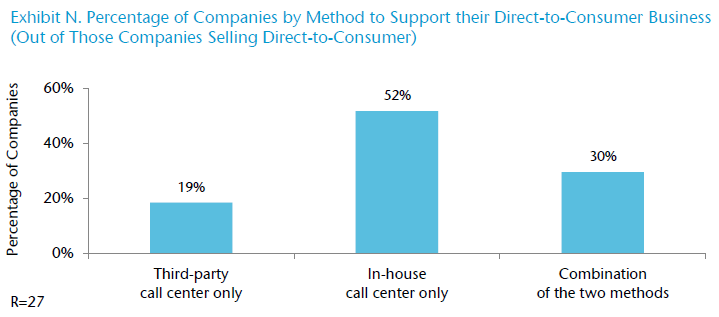
In this year’s survey, over half of the companies reported they were selling direct-to-consumer. (Exhibit M) This was defined as selling a Medicare Supplement policy over the phone, online, through the mail, or a combination of these methods without assistance from a traditional agent that is paid a traditional compensation.

Most companies support their direct-to-consumer business using an in-house call center, although five companies reported relying completely on a third-party call center. (Exhibit N)
Download the PDF version for a list of participating companies.


