-
Property & Casualty
Property & Casualty Overview

Property & Casualty
We offer a full range of reinsurance products and the expertise of our talented reinsurance team.
Trending Topics
Publication
Production of Lithium-Ion Batteries
Publication
Time to Limit the Risk of Cyber War in Property (Re)insurance
Publication
Generative Artificial Intelligence in Insurance – Three Lessons for Transformation from Past Arrivals of General-Purpose Technologies
Publication
Human Activity Generates Carbon and Warms the Atmosphere. Is Human Ingenuity Part of the Solution?
Publication
Inflation – What’s Next for the Insurance Industry and the Policyholders it Serves?
Publication
Pedestrian Fatalities Are on the Rise. How Do We Fix That? -
Life & Health
Life & Health Overview

Life & Health
We offer a full range of reinsurance products and the expertise of our talented reinsurance team.
Training & Education
Publication
Key Takeaways From Our U.S. Claims Fraud Survey
Publication
The Effects of Heatwaves – A Look at Heat-related Mortality in Europe and South Korea
Publication
The Key Elements of Critical Illness Definitions for Mental Health Disorders
Publication
An Overview of Mitral Regurgitation Heart Valve Disorder – and Underwriting Considerations
Publication
Body Mass Index as a Predictor of Cardiovascular Health Moving The Dial On Mental Health
 -
Knowledge Center
Knowledge Center Overview

Knowledge Center
Our global experts share their insights on insurance industry topics.
Trending Topics -
About Us
About Us OverviewCorporate Information

Meet Gen Re
Gen Re delivers reinsurance solutions to the Life & Health and Property & Casualty insurance industries.
- Careers Careers
Social Inflation Is Complicated and Costly – The Products Liability Paradox [Part 3 of 5-Part Series]

July 07, 2021
Christopher Mackeprang,
Tom Karol, General Counsel for NAMIC (guest contributor)
Region: North America
English
This is part three of a five-part series – in partnership with NAMIC – examining social inflation and its impact on insurers. Future parts will cover Claims and Emerging Issues.
As social inflation has been more widely examined in recent years, it has grown to encompass almost any unfavorable aspect of modern Casualty insurance. However, while many Casualty lines are under strain, there are also some Casualty lines that are performing well despite purportedly being susceptible to many of the same social inflationary forces. Segmenting Casualty lines into those performing well and those under strain, and considering what the well-performing lines have in common that is not shared by the lines under strain, can help further define which aspects of social inflation are most impactful. This information is crucial to formulating an effective response against these damaging influences.
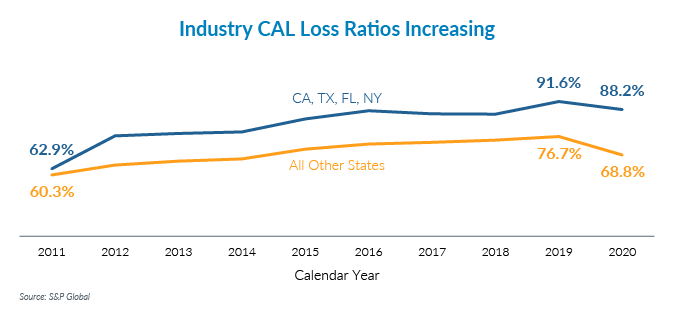
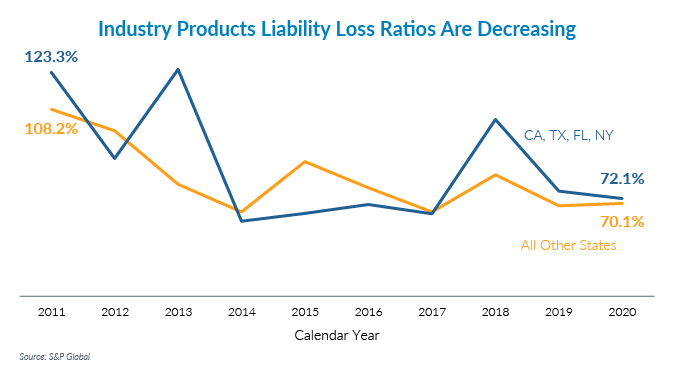
Consider that industry-wide loss ratios have grown steadily over the past 10 years in Commercial Auto Liability (CAL) and Other Liability Occurrence (OLO, which includes Umbrella), but have shrunk in Products Liability (PL). The change in calendar year loss ratios reflects the late development from prior accident years, which highlights unexpected changes in market conditions – such as social inflation. Even though some PL business is written on a claims-made basis, the downward trajectory of calendar year loss ratios is still indicative of improving market conditions for the line. The four largest states – California, Florida, New York, and Texas – represent roughly 40% market share in each of these lines and have loss ratios higher than the rest of the states, but loss ratios are moving in the same direction for all states. What is happening in CAL and OLO that is not happening in PL?

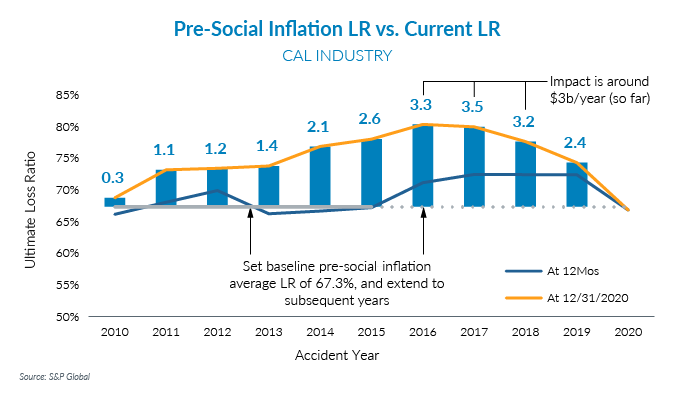
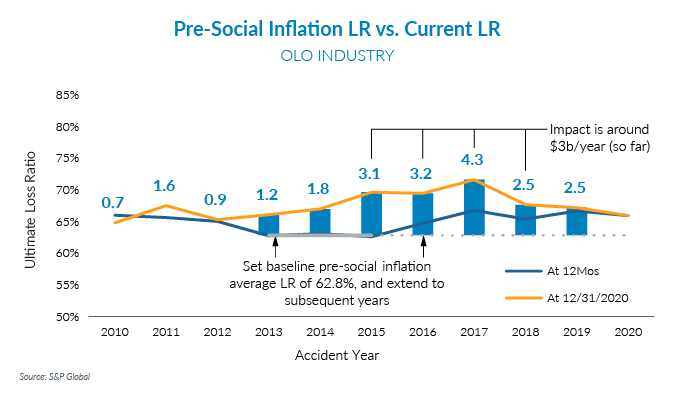
To answer that question, it is helpful to put some context around these increasing loss ratios by estimating the overall dollar impact. If what the loss ratio would have been in recent years without social inflation was known, it could be compared against the actual loss ratio and that difference multiplied by the premium to measure the magnitude. This is impossible, of course, but an approximation based on historical data can be made. One rough estimate of this “pre-social-inflation” loss ratio is the average ultimate loss ratio at 12‑months maturity for the years leading up to the onset of social inflation – widely accepted as around 2016. For CAL this baseline is 67.3%, and for OLO this is 62.8%.
If these loss ratios had continued, instead of the actual loss ratios at the latest valuation, then industry-wide losses would have been more than $3 billion per year lower for CAL and roughly the same for OLO, or more than $6 billion per year total. It’s impossible to know for certain how these years would have played out under different circumstances, but this gives a rough estimate of the magnitude.
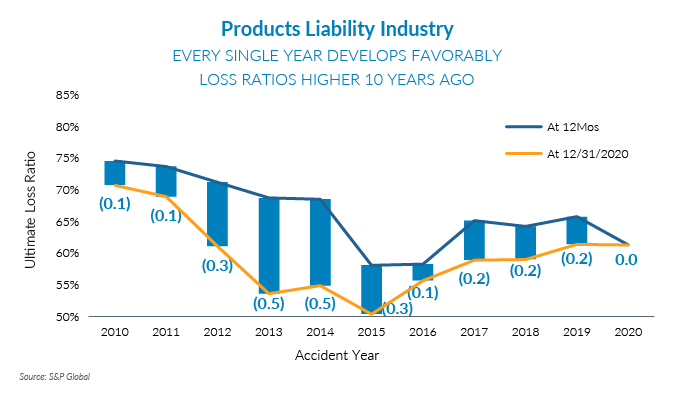
Meanwhile, for PL, every single recent accident year has developed favorably by around $200 million per year, and loss ratios were higher 10 years ago than they are today. Note that the upward trajectory of recent loss ratios is somewhat illusory since it can safely be assumed that recent years will also experience future favorable development similar to prior years. Granted, the fact that some PL business is written on a claims-made basis helps shorten the reporting pattern, but this favorable development is in stark contrast to the deterioration seen in CAL and OLO. This is counterintuitive, as PL would seem to be susceptible to many of the same causes of social inflation that are driving up the CAL and OLO loss ratios, including:
- Nuclear verdicts, since many of the largest verdicts in recent years come from products cases such as weed killer, talc powder, tobacco, car manufacturers, pharmaceuticals, etc.
- Reptile Theory tactics, where a plaintiff’s lawyer appeals to jurors’ emotions by portraying the defendant as a threat to society that demands harsh punishment
- Increased anti-corporate sentiment among jurors
Furthermore, since PL is a much smaller line than the other two, it would not take as much claim activity to have a noticeable impact on results. Various measures of industry-wide rate change suggest that PL rates have not increased as much as other Casualty lines, implying that loss activity, rather than premium adequacy, is to blame. There are many other differences between these three Casualty lines, but one would still expect that they all would suffer if the above judicial phenomena were the leading drivers of social inflation. While the importance of the issues listed above cannot be discounted, other factors appear to be having an even greater impact.
One notable distinction between these lines is the types of injuries sustained. The claims for CAL and OLO – of which Umbrella is a major component – contain a high concentration of auto accidents, where high-speed blunt force trauma injuries result from vehicle operation. PL claims contain a much broader range of injury types, from a wider array of potential hazards, and the PL line is more diversified. For example, if exercise equipment gets 5% more dangerous next year, that only affects a small subset of PL risks, whereas if vehicles get 5% more dangerous next year, that affects all of CAL and much of OLO.
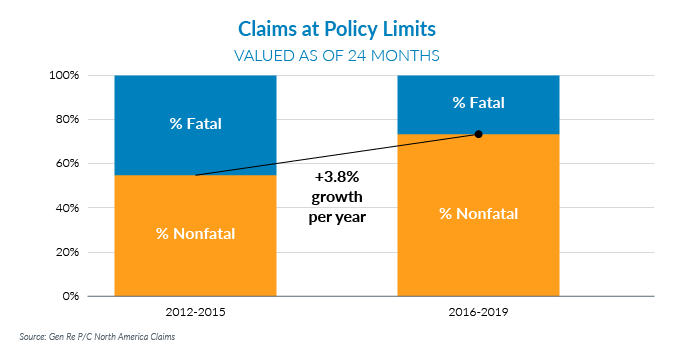
Looking at Gen Re’s Personal Umbrella claim experience provides further insight. Personal Umbrella was selected because it contains fairly homogenous exposures and claim types, is a Casualty line that appears to be impacted by social inflation, and is an excess cover that captures changes in large claim severity. A key finding was that among claims that hit the Personal Umbrella policy limit, a growing proportion of those claims are coming from non-fatal injuries. This would be expected if improved vehicle safety was preventing fatalities and instead an otherwise-fatal crash resulted only in injury, but National Highway Traffic Safety Administration data suggests this accounts for only a small part of the growth.1 Instead, a dramatic shift in the make‑up of large claims is occurring. Insurance claims executives have observed a marked increase in non-fatal traumatic brain injuries, and more work is being done to quantify this. It appears that this increase, which would have a substantial impact on CAL and OLO but a relatively minor impact on PL, may be driving much of the social inflation seen across Casualty lines.
Social inflation has had a profound impact on Casualty insurers in recent years and is expected to increase for the foreseeable future. There is still much to learn about social inflation, its causes, and its impacts. Understanding what is driving social inflation is crucial to developing an effective response; for example, is it more important to focus on improved safety to reduce injuries, or on tort reform to reduce bias in the judicial system?
While many interconnected factors contribute to social inflation, this analysis suggests that an increase in non-fatal auto accidents may be one of the most influential. Unless specific appropriate actions are taken to address the recognized causes of social inflation, Casualty insurance results will continue to suffer.
Next up: In part four of this series, Gen Re’s Glenn Frankel, Head of North America P/C Claims, and Tim Fletcher, Senior Emerging Issues Specialist, with Andrew Pauley, Government Affairs Counsel at NAMIC, will examine social inflation from a claims perspective.
Endnote
- https://cdan.nhtsa.gov/tsftables/National%20Statistics.pdf
Per NHTSA data, the ratio of “(Traffic Injuries) / (Traffic Fatalities + Traffic Injuries)” is only growing 0.017% per year. Because only 1.4% of total traffic crash victims are fatalities and 98.6% are non-fatal injuries, the proportion of non-fatal injuries cannot grow much before approaching 100%.
 Tom Karol serves as General Counsel - Federal in NAMIC’s Washington office. Tom represents NAMIC in Washington on issues impacting Property/Casualty insurance companies and has primary management of NAMIC’s response to Dodd-Frank legislation and regulation. He is also the Leader of NAMIC’s Investment Services Practice.
Tom has extensive legal, regulatory and operations experience with major financial services companies, law firms, regulatory agencies and Congress. He was a leader in Deloitte’s Global Financial Services practice, a supervisory principal for a broker dealer, with the S.E.C. Division of Enforcement and with the U.S. Senate Committee on Governmental Affairs. Tom graduated from the University of Notre Dame Law School and has a political science degree from St. John Fisher College in Rochester, New York.


