-
Property & Casualty
Property & Casualty Overview

Property & Casualty
We offer a full range of reinsurance products and the expertise of our talented reinsurance team.
Trending Topics
Publication
Engineered Stone – A Real Emergence of Silicosis
Publication
Use of Artificial Intelligence in Fire Protection and Property Insurance – Opportunities and Challenges
Publication
Generative Artificial Intelligence and Its Implications for Weather and Climate Risk Management in Insurance
Publication
Public Administrations’ Liability – Jurisprudential Evolution, Insurance Implications, and a Comparative Analysis Across Countries
Publication
Risk Management Review 2025
Publication
Who’s Really Behind That Lawsuit? – Claims Handling Challenges From Third-Party Litigation Funding -
Life & Health
Life & Health Overview

Life & Health
We offer a full range of reinsurance products and the expertise of our talented reinsurance team.
Training & Education
Publication
AI Agent Potential – How Orchestration and Contextual Foundations Can Reshape (Re)Insurance Workflows
Publication
Diabetes and Critical Illness Insurance – Bridging the Protection Gap
Publication
Group Medical EOI Underwriting – Snapshot of U.S. Benchmark Survey
Publication
Why HIV Progress Matters
Publication
Dying Gracefully – Legal, Ethical, and Insurance Perspectives on Medical Assistance in Dying Moving The Dial On Mental Health
 -
Knowledge Center
Knowledge Center Overview

Knowledge Center
Our global experts share their insights on insurance industry topics.
Trending Topics -
About Us
About Us OverviewCorporate Information

Meet Gen Re
Gen Re delivers reinsurance solutions to the Life & Health and Property & Casualty insurance industries.
- Careers Careers
South African Group Mortality Experience

April 02, 2014
Louis Rossouw,
John-Craig Clur (University of Cape Town)
Region: South Africa
English
The group market in South Africa is well-developed and competitive. This article provides an overview of an analysis of the South African group mortality experience.1,2 This analysis, the first of its kind in this market, was conducted by Gen Re in collaboration with Professor Rob Dorrington and John-Craig Clur of the University of Cape Town. The document covers the background of the market, how the data was analysed and the key results of this analysis. We also cover interesting methodologies developed to model the results, taking into account the HIV/AIDS epidemic in South Africa.
The employer-based group insurance market in South Africa is well-developed, characterised by complicated practices and highly competitive; however, it has not been well researched. Gen Re has slowly been attempting to improve on this situation. In previous work by Gen Re authors, who produced a general overview of the group market, the key features of the South African group market were:3
- The market is based on employer-based group with mainly compulsory benefits for employees.
- Death and disability benefits (both lump sum and income) form the major benefits offered in this market.
- The market is dominated by 12 insurance companies, with the four largest accounting for about 70% of the market.
- Pricing is based on technical (or “book”) rates as well as for groups larger than 200. Generally the market also allows on a credibility-weighted basis for the experience of the individual schemes.
- This work identified the problems associated with verifying the technical mortality bases used in group pricing.
South Africa is also in a process of social security reform; the Actuarial Society of South Africa is engaged in the process and assisting where possible. One aspect of retirement reform that will be important in this process is assumptions around the mortality of employed lives.
Given this background, research was undertaken to improve the understanding of the mortality experience of the group insurance market.
Data
The data collected was submitted by six South African life insurance companies:
- Sanlam
- Old Mutual
- Momentum
- Metropolitan
- Liberty
- Capital Alliance
Key features of the data collected included the following:
- Data was for employer-based compulsory group life insurance.
- Data covered the period from January 2005 to December 2009.
Data covered employed members of the workforce and therefore includes only lives that are in reasonably good health and excludes unemployed and informally employed. It also excludes retired members (including members who retired due to ill health).
Disabled members may still be present due to groups continuing to offer group life cover to members receiving disability income from the group.
Data contained information on the age, gender, salaries and benefits of individual members. It also contained information on the industry and location (province) of the employer for each particular group.
Various checks and adjustments needed to be made to the data:
- Completeness of all variables was checked. Missing values needed to be adjusted as individual records with missing data could not be excluded. Where a particular group’s data was of low quality, the whole group was excluded.
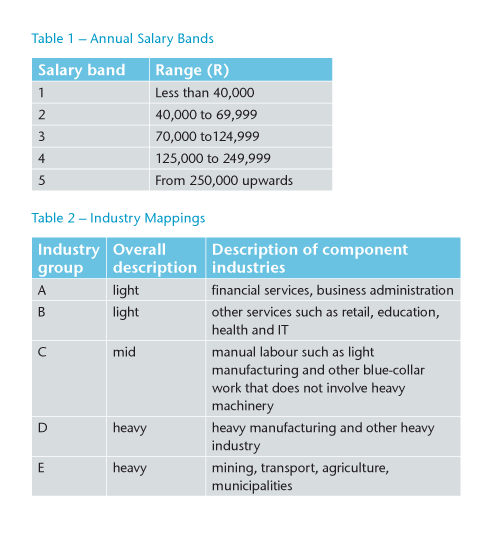
- Salary data had to be inflated to January 2010 values. Salaries were also banded as per Table 1. Unrealistic salaries were investigated and corrected where needed.
- Industry data from various companies was first mapped to a common categorisation labelled A-E. This was further grouped, as per Table 2.
Late reporting of claims
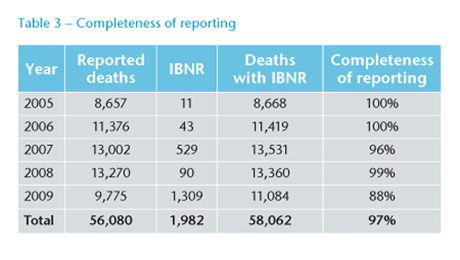
Because claims are reported after delays, allowance was needed for late reporting. Individual life insurance companies also had different delay times. Late reported claims were allowed for, based on claims development factors derived from a simple numbers-based basic chain-ladder for each company. Actual claims were then grossed-up, using the derived development factors. Table 3 summarises the completeness of reporting by calendar year.
Results
The analysis produced many interesting results. This section discusses some of the crude mortality results, which refer to mortality results before modelling, as well as the modelling approach.
When comparing the crude mortality rates, one has to take account of variations in other factors between the two groups being compared. In this case we are comparing the mortality of males and females. However, the average age of the females (38.7) is almost two years younger than the average age of males (40.6). Also, the average salary for females was approximately 18% lower. Both of these factors have an impact on mortality, so the crude mortality rates were standardised to take account for them.
Figure 1 shows some clear trends. Mortality rates for females are consistently lower than for males, as is generally expected; also increasing salaries are correlated with lower mortality. The average combined mortality in the lowest salary band is approximately six times that of the highest salary band.
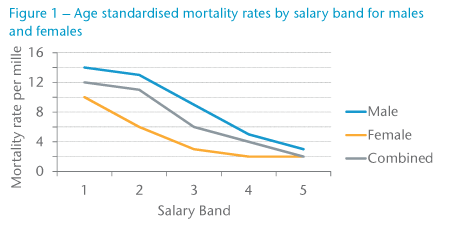
Figure 2 shows the age-standardised mortality rates for males by salary band and industry groupings. The results show a remarkable consistency. For all industries, increasing salary is correlated with reducing mortality. Also, for all but one of the salary bands, heavier industries are associated with higher mortality.
Note also how the differentials between the various industries tend to reduce with increasing salary. This is likely indicative that at higher salaries the industry does not play as an important a role in the mortality. This could be due to higher salaries being more associated with office and/or managerial work that may be less exposed to risk factors particular to the industry.
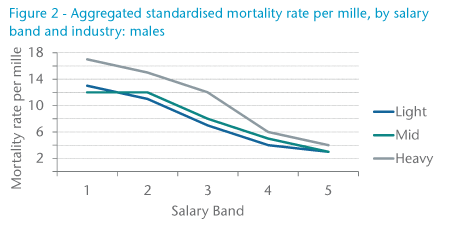
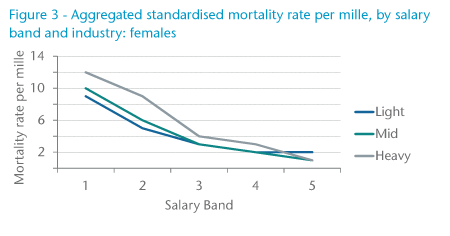
Figure 3 shows the same data for females, and a very similar picture. The smaller numbers of deaths make results less than significant, especially in the highest salary bands.
From the above analysis, it is clear that salary is highly correlated with mortality, which was then investigated in more detail. Data was grouped into 20 salary bands. Figure 4 plots the age and industry-standardised mortality rate for each of these salary bands against the average salary in that band. It shows much more clearly the relationship between salary and mortality.
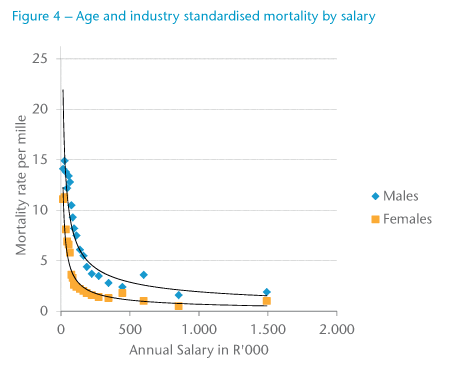
It shows rapidly reducing mortality as the salaries increase to R200,000 per annum; thereafter mortality reduces much more slowly. Initially, male mortality reduces more slowly than female mortality (up to R70,000 per annum), but then reduces relatively quickly.
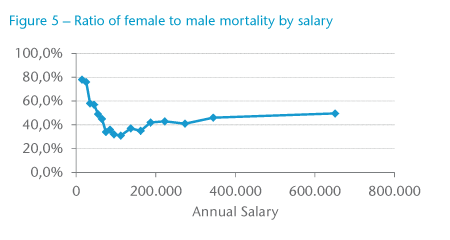
The ratio of female to male mortality (see Figure 5) also shows an interesting relationship. At very low salaries, the ratio is quite close but rapidly reduces, eventually returning to roughly 50% at the highest salary band.
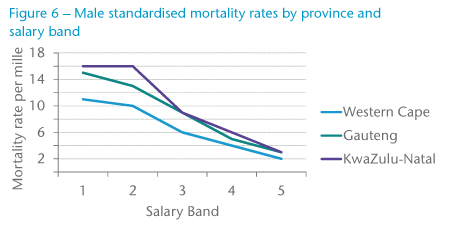
HIV prevalence in South Africa varies significantly by province, which has a corresponding impact on HIV-related mortality; between this and other factors, mortality varies significantly by province.
Figure 6 shows the clear association between province and mortality. The higher mortality in KwaZulu-Natal is most likely the result of the fact that it is the province in South Africa with the highest HIV prevalence. Correspondingly, the Western Cape has low prevalence. Gauteng prevalence (and mortality) is most consistent with the respective national averages.
Modelling mortality
Initial investigations into modelling the mortality considered the use of traditional graduation methods in order to model the mortality rates by age, sex, industry grouping and salary band.
The results from these initial graduations produced mortality rates that were satisfactory in terms of the goodness-of-fit and smoothness; however, two problems were identified:
- When a comparison of the mortality rates between the various industry groups and salary bands was conducted, it was evident that the mortality rates for certain sub-groups (i.e., mortality rates within a single industry group and salary band) failed to capture industry and salary band mortality trends observed in other groups.
- There was a limited exposure in certain sub-populations due to the data being subdivided by sex, industry group and salary band, and this allowed for some cases where a cross-over of mortality rates was observed (contrary to what would be expected).
The final method used to graduate the mortality of members of group schemes data was a parametric multivariate model that was fitted using age, salary band and industry as explanatory variables. While it was possible to incorporate sex as an additional explanatory variable in the model, a decision was taken to graduate the mortality rates for males and females separately due to the inherent differences in the mortality trends observed between males and females. Two sets of mortality rates were produced for ages 25 – 65. The first set was the GL05-09 Aggregate mortality rates, which provided the aggregated mortality rates by sex, and the second set was the GL05-09 rates, which provided mortality rates by industry grouping and salary band for each sex.
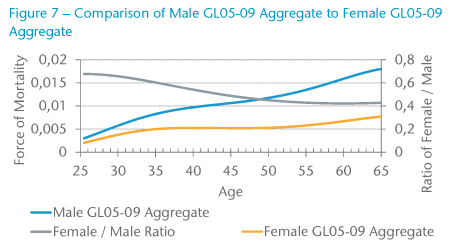
When considering the GL05-09 Aggregate mortality rates, as shown in Figure 7, it is interesting to note the differences between the male and female mortality rates and how the ratio decreases with age and then levels off after age 55. Furthermore, there is a hump in the mortality rates between ages 25 – 45, which could be attributed to AIDS-related deaths.
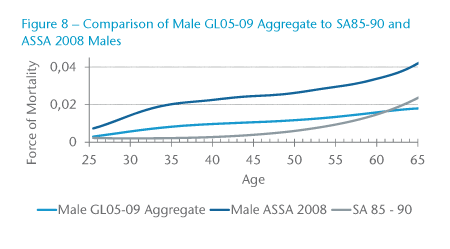
In comparing the GL05-09 Aggregate male mortality rates with South African population mortality rates (represented by the ASSA2008 mortality rates) in Figure 8, it is evident that the mortality of members of group schemes is lower than that of the general population. This is expected due to the implicit actively-at-work selection effect, which is an integral part of group schemes, and would explain the “healthy-worker effect” observed with the lower mortality rates in group scheme mortality rates. On the other hand, only a limited number of individuals within group schemes are required to go for underwriting, namely those with benefit levels in excess of the free-cover limit for the particular scheme. Consequently, when comparing the mortality rates for the members of group schemes to those of individual assured policyholders, one would expect the mortality of individual assured lives to have a lower mortality rate due to the more stringent underwriting requirements. It is therefore surprising, when considering the mortality experience of the GL05-09 aggregate male rates in Figure 8 to those of the individual assured lives population in South Africa (represented by SA85-90 Ultimate for males), to see a reversal in this relationship for ages above 60. However, this can in part be explained due to a selection effect as a result of early retirements and ill-health retirements, leaving only individuals who are healthy and want to work within the work force. Similar results were also obtained for females.
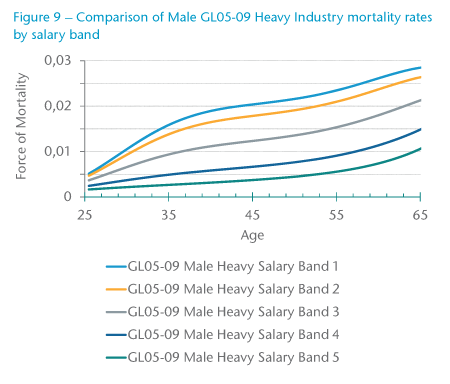
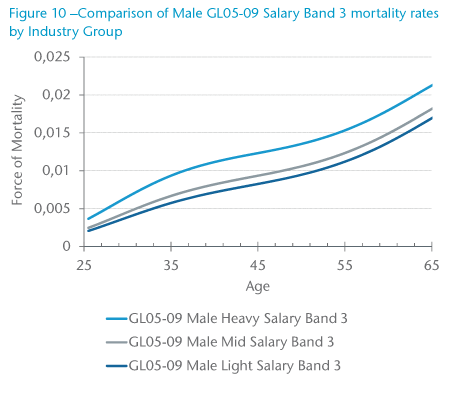
One of the biggest advantages of using the multivariate parametric model to graduate the group scheme member mortality data is that a single graduation was carried out rather than performing individual graduations for each sub-population. In addition, the form of the model ensured that the graduated mortality rates maintained the expected relationships between different salary bands and industry groups so that there was no crossover of mortality rates as age increased. As seen in Figure 9, the Male GL05-09 Heavy Industry mortality rates reduced as salary band increased, and in Figure 10, the Male GL05-09 Salary Band 3 mortality rates reduce as industry decreases from Heavy to Mid to Light.
Taking things forward
This article provided an overview to some new research in the South African market on the mortality of insured lives of employer-based group insurance policies.
Some clear new insights emerged from this research:
- Clarification of the relationships between salary and industry, and the resultant mortality
- The differing impact of these factors by gender of the insured
- The impact of provincial differences in mortality
- Usefulness of some innovative graduation techniques to take account of the multitude of factors affecting the mortality
As a result, this research would be invaluable in developing a new pricing basis for a company doing group insurance business in South Africa. However, implementing a new pricing basis can be quite disruptive. What is technically correct and accurate on paper may return rates that are contradictory to what the market is willing to accept. For example, a new basis may result in an increase for a group that had very profitable experience. This would be very hard to explain to such a client.
A leading piece of research, such as this, could be disruptive to the market. Early adopters in the market could reap substantial benefits from implementing strategies that are able to exploit pockets of advantage.
Moreover, implementing such a new basis should be done with care and consideration. The impact on the existing portfolio of business needs to be understood. Analysis should be done, and it should be clear where the basis results in more competitive pricing as well as less competitive pricing. Such impact studies should be extended to analysing the books of business per channel and individual distributors to identify problems and advantages.
Technical accuracy needs to be blended with market forces. Only when this occurs can a group insurer fully take advantage of the results of this research.


